Everything's big in Texas - at least that's what they say! Therefore let's have a bit of graphical fun, and use Texas as a unit of measure (let's call it a 'tex'). More on that later - but first, here's a picture of my friend Jennifer posing beside a rather large handgun in Texas (how much more 'Texas' can you get, eh?!?)

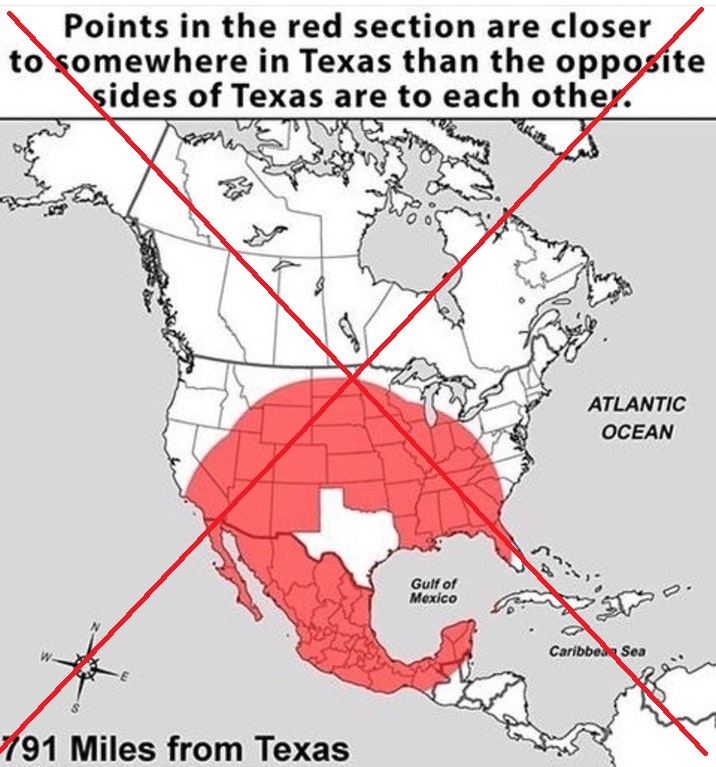
And now, let's create a cool graph! Below is the original graph that gave me the idea. I had seen it a few places online, and I believe it was created by reddit user Armeleon. The map visually caught my attention, and I found the topic a bit intriguing (having lived in Texas when I worked at Shell Oil's research center long ago).
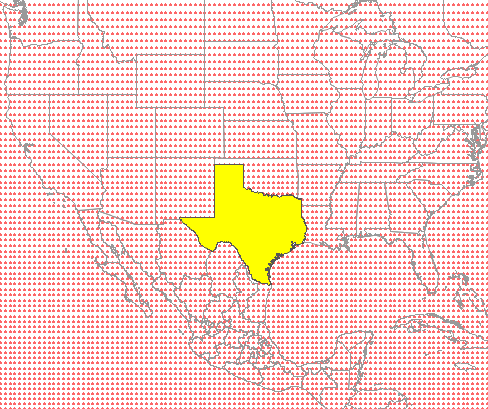
I thought it would be a fun challenge to see if I could create a similar map using our SAS software, so I gave it a shot. First, I looped through the nearby latitudes and longitudes, and created a grid of dots. I annotated these dots behind the map, and then made all the map areas transparent except for Texas (which I made solid yellow).
I then used brute force to determine which of the dots were within "1 tex" (801 miles) of the Texas border. I did this by taking every dot in the grid, and pairing it up with every point along the Texas border (using an SQL join), and then using the geodist() function to calculate the distance between every grid dot and every point along the Texas border. Then, for each grid point, I kept the pairing with the minimum distance to the border, and finally limited it to just the dots within 1 tex. (Armeleon used 791 miles as his distance, but according to Wikipedia, "The longest straight-line distance [in Texas]is from the northwest corner of the panhandle to the Rio Grande river just below Brownsville, 801 miles" ... therefore I used 801.)
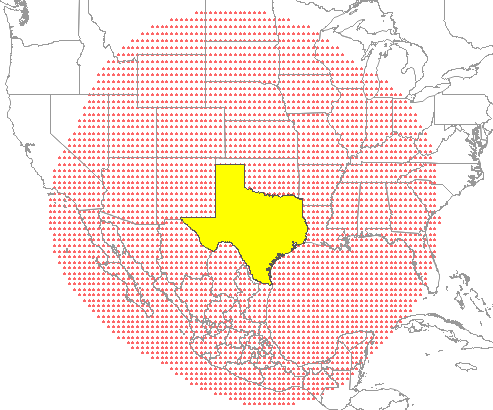
Next, I eliminated all the points that were not on land. I did this by using Proc Ginside to determine which land area each red dot was inside of. If a red dot wasn't inside a land area, then I discarded it.
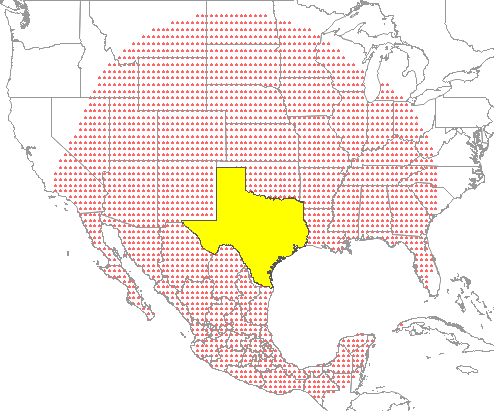
And for the final touch, I increased the density of the dots, using "by .01" rather than "by .05" in my loop when I created the grid of dots. This makes the dots so close together that they touched/overlap one another, and look like a continuous red area rather than a grid of dots.
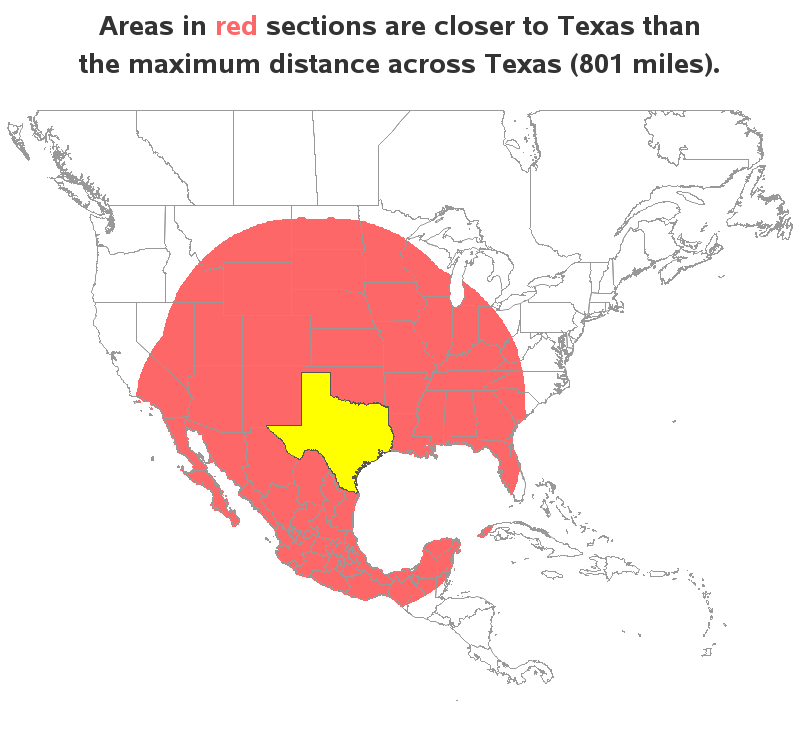
Do you live within 1 tex of Texas (in the red zone)? I think it's interesting that Cuba (all the way across the Gulf of Mexico) is within that zone! Looks like I live just outside the zone, here in central North Carolina.


6 Comments
Very trivia-ish. Excellent!!!
Side note: I'm slowly working my way through your other posts. Excellent content.
~ A dude-tte from Texas
Welcome, dude-tte from Texas!
Sure, Texas is big. But it still fits easily into Mother Russia, with plenty of space to spare.
Rob,
I would expect the cloud of red points before you eliminated the not-on-land-points would be more "Texas-shaped". Do you know why it is not?
If you were measuring points just straight out from the center of Texas, or just points perpendicular to Texas' border, then the red cloud would be more Texas-shaped ... but since you're measuring the distance from all possible points along the border, it kind of 'smooths' out the shape.
Very cool, thank you,
--Al from Austin